4
tooltip: {
        trigger: "axis",
        axisPointer: {
            type: "shadow",
            shadowStyle: {
                color:’blue‘;,
                opacity: 0.1,
            },
        },
},
tooltip: {
trigger: "axis",
axisPointer: {
type: "shadow",
shadowStyle: {
color:’blue‘;,
opacity: 0.1,
},
},
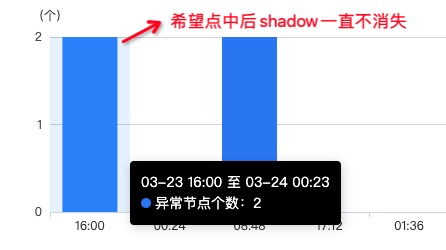
},点击echarts柱状图后,点中柱子的阴影不会消失,直到点中的下一柱子再次消失,请问该如何处理?
@emyly 你好,目前提供选中图形的方法有两种,一种是select方法,参见select文档。 第二种是用on监听'click'事件,然后监测到click之后对option进行改变,参考鼠标事件。
以下提供一种select的方案,可供参考
@jiawulin001 我还想问下echarts柱状图,柱子太短应该怎么实现点击
有没有示例或者截图让我更快了解你的情况?
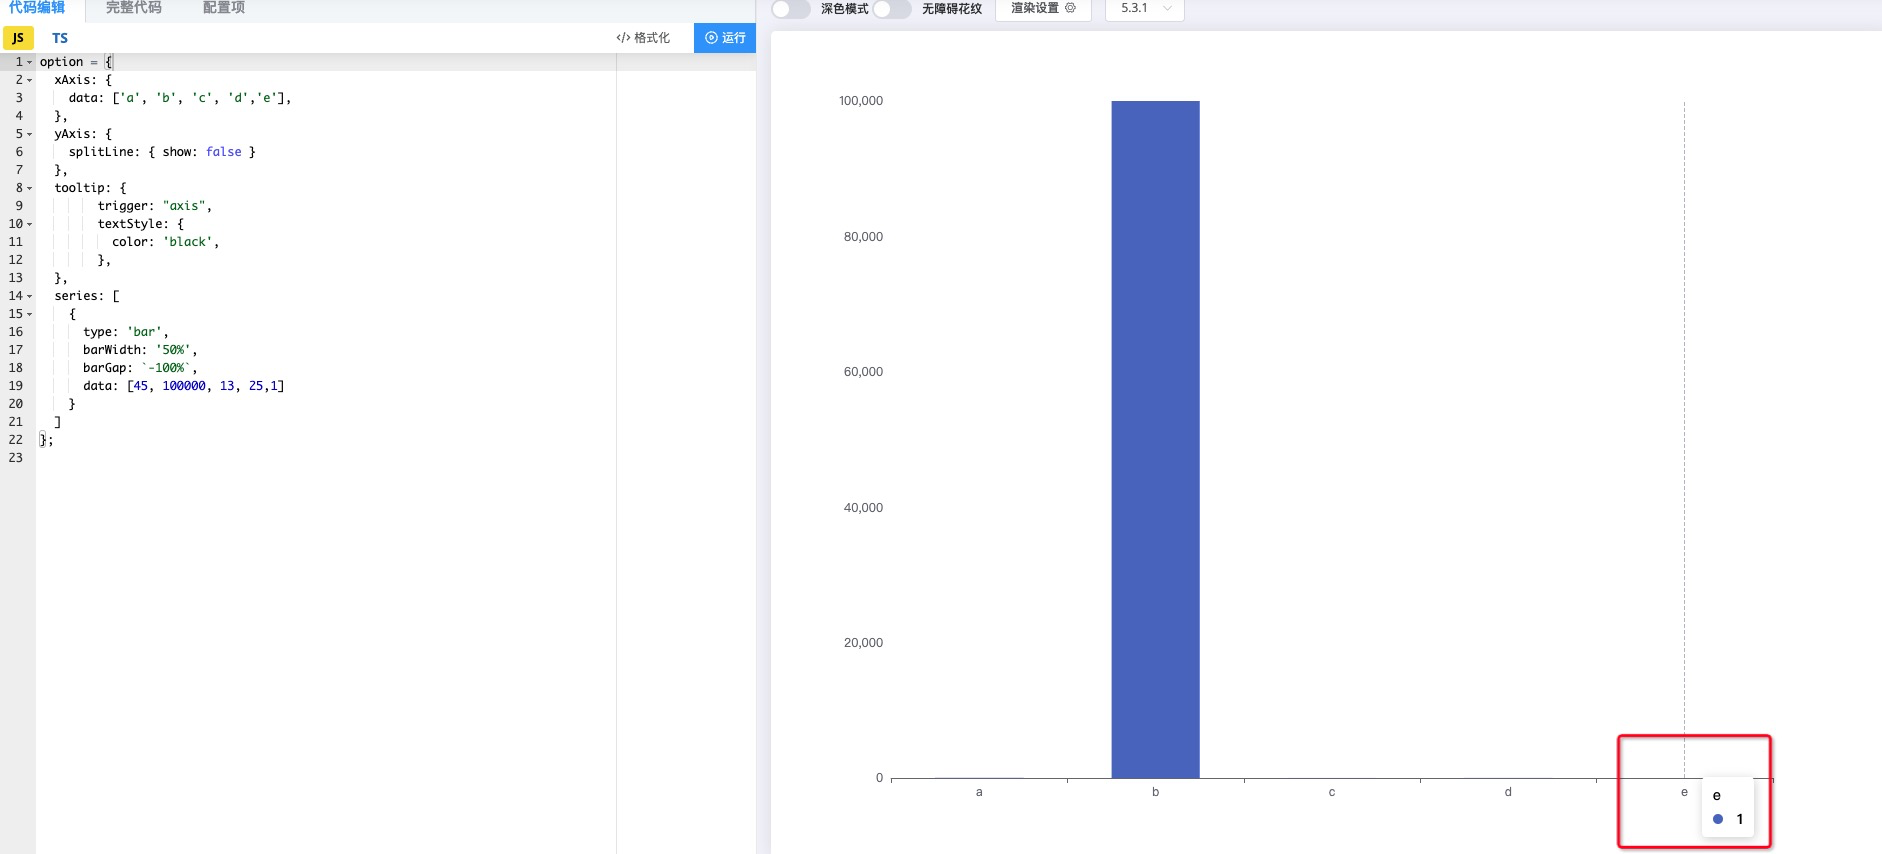 像这种数据很小的柱子会有点不中的情况
可加入dataZoom选项来加入缩放功能,具体可参考文档。
@emyly 另外你最初说的那个效果可以用on添加监听'click'事件实现,这里给出一个示例,具体数据可能需要你自己调。
好的,感谢,很好的方法